In today’s post I’m going to share about Azure Application Insights Live Metrics, and the importance to know what is happening LIVE!
Sometimes it is really painful to go after the logs to find an error or to determine when and what happened.
In order to simplify your life, you can use Azure Application Insights which can be used to monitor applications even if they are not hosted in Azure.
In summary, you install a small instrumentation package in your application, and set up an Application Insights in the Microsoft Azure portal. The instrumenation monitors your app and sends telemetry data to Azure Monitor.
One of the features available on Application Insights is the Live Metrics that allows you to see in real time what’s happening with your application
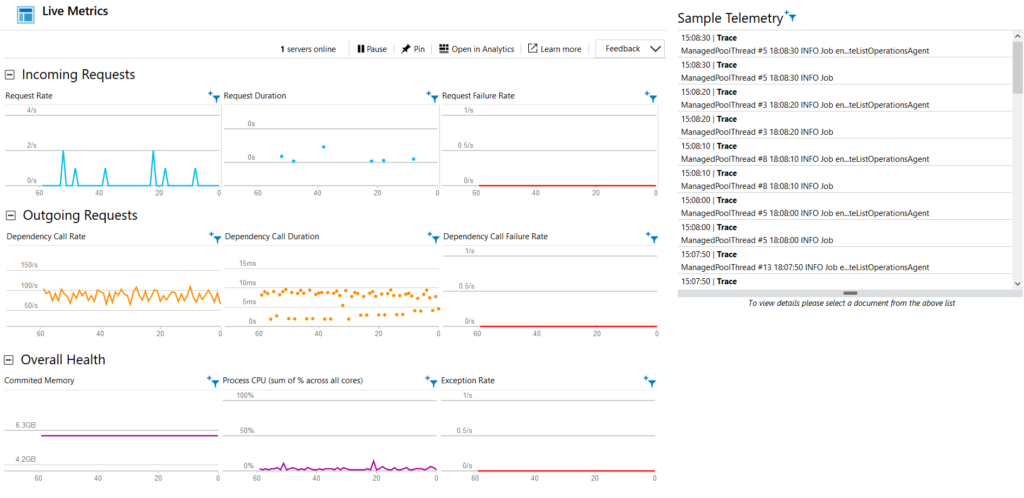
As you can see, it is a good overview to have from your application, especially if you know that something is going on and today I want to highlight the Sample Telemetry at your right.
Sample Telemetry
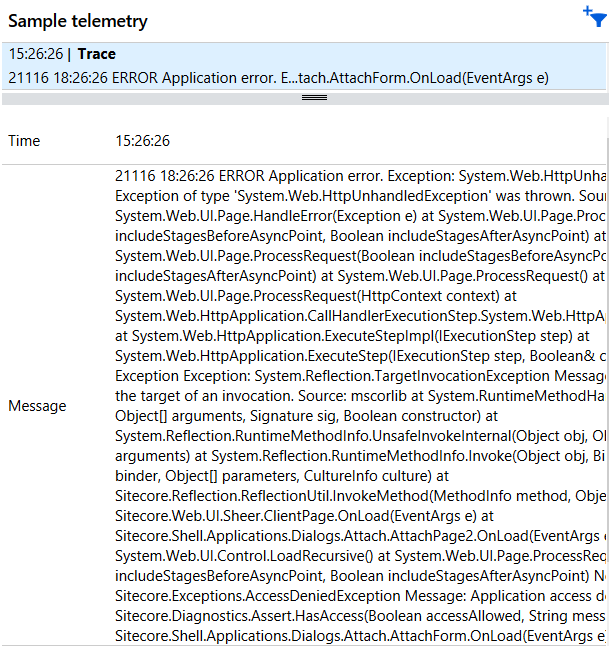
Sample Telemetry is responsible to show in real time what’s being captured from your application’s log which becomes very handy when in need to troubleshoot and capture an error.
You probably recall when I had to troubleshoot a user’s Access Denied error when tried to attach an item in Sitecore. At that time, I used a different feature from Application Insights but I could have used Live Metrics instead
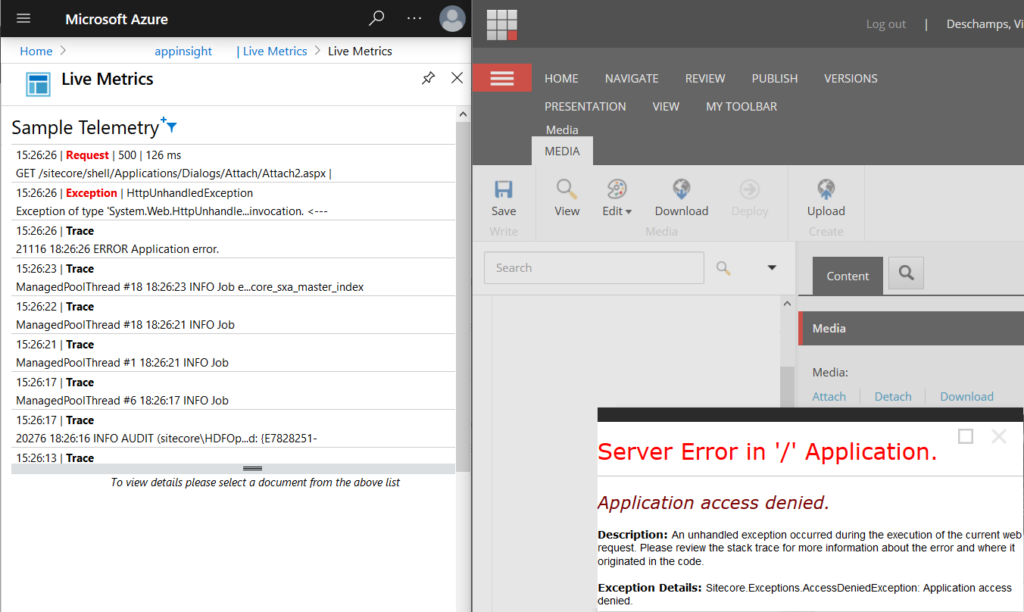
By placing the browser windows side by side, and reproducing the error, it is possible to see the Sample Telemetry capturing the exact moment the Application access denied error, and view details just selecting the entry from the list
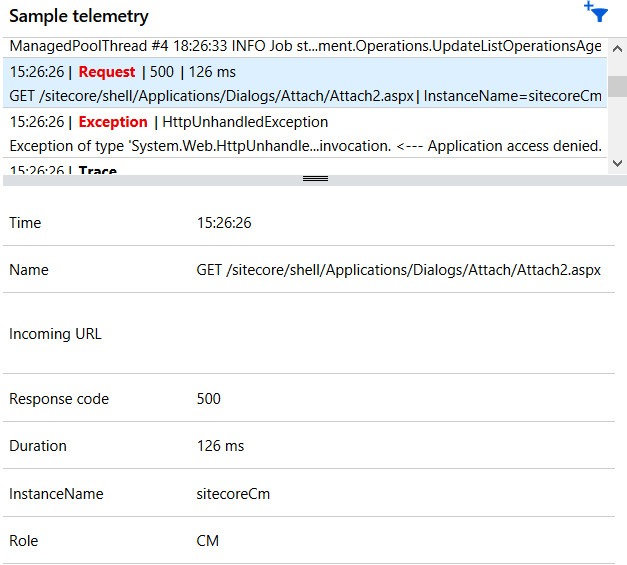
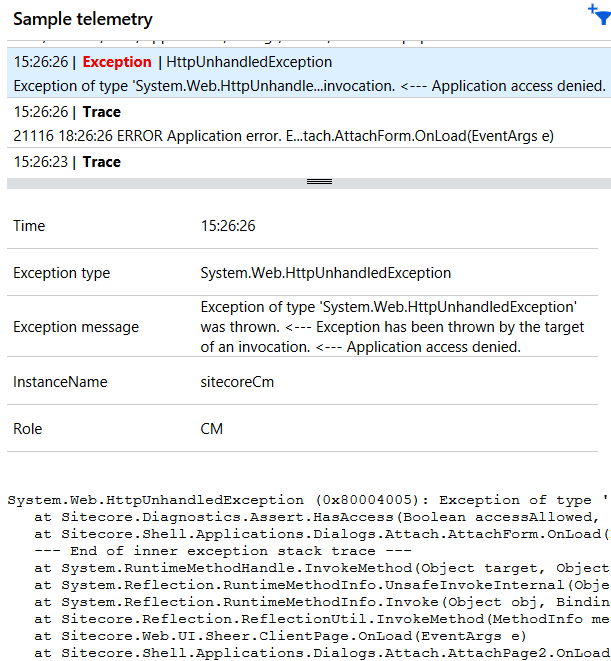
It’s a great option, isn’t it? Please consider using it in your application – if you are not using it yet – and enjoy a powerful way to troubleshoot from now on with Live Metrics.
I hope you liked it, and I see you on my next post.
Photo by Isaac Smith on Unsplash
